
Data Analytics for your business
The world today is fast paced, competitive and data driven.
The world today is fast paced, competitive and data driven.

Have you ever noticed how Apple is literally everywhere?
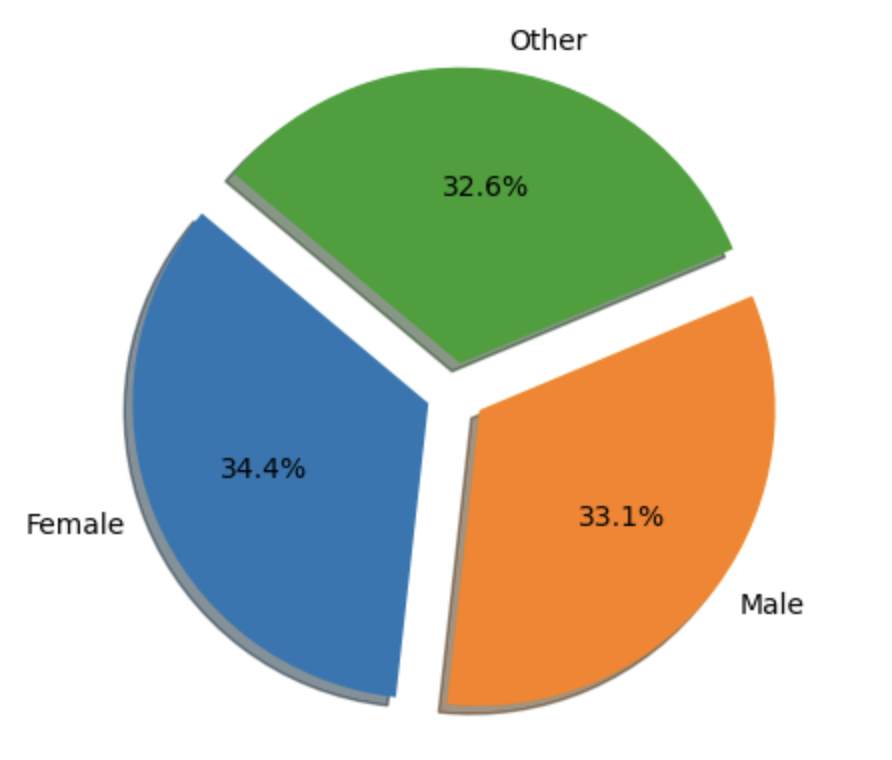
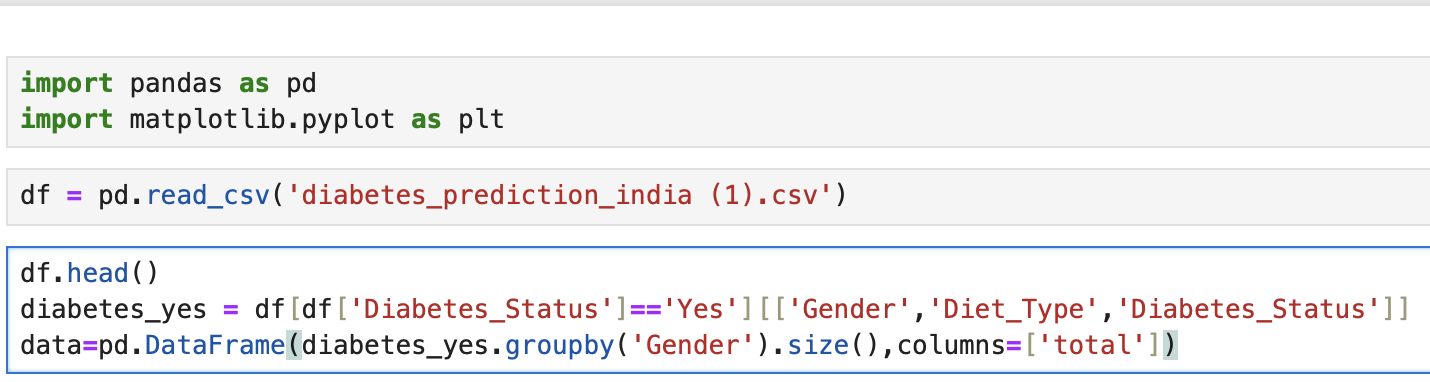
Diabetes is a growing health concern in India, affecting millions of people. To understand its impact better, I recently analyzed a small dataset related to diabetes in India using Python. I used Pandas to filter the data and Matplotlib to visualize trends, specifically focusing on gender distribution.
started by loading the dataset into a Pandas DataFrame and filtering it based on gender. The dataset included three categories:
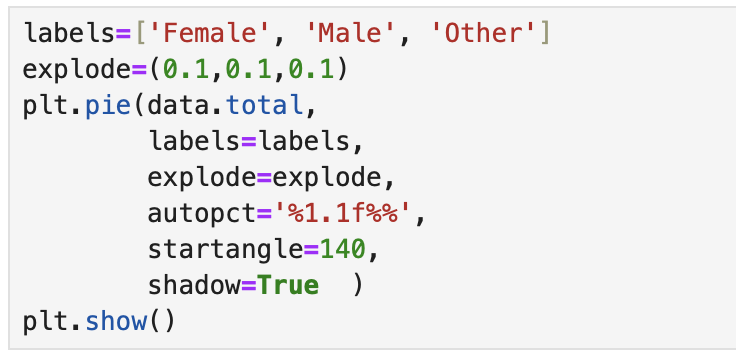
To get a clearer picture, I used Matplotlib to create a pie chart showing the percentage of diabetes cases for each gender.
From the analysis, the diabetes prevalence among different gender groups is:
These percentages show that diabetes is fairly evenly distributed across all gender groups, with females having the highest prevalence (34.4%). This could indicate potential biological, lifestyle, or healthcare-related factors that make females slightly more susceptible.
However, the differences are not very large, suggesting that diabetes affects all genders almost equally.
The dataset used here has been taken from kaggle. Link below
diabetes-prediction-in-india-dataset